
Rule changes and fallout from the recent Clover Health lawsuit verdict are reshaping how CMS calculates Star Ratings, and Medicare Advantage (MA) organizations that do not pivot fast enough could face severe consequences.
A half-point drop in Star Ratings for an MA plan covering 480,000 members can cost an estimated $260+ million in Quality Bonus Payment (QBP) reductions alone, according to our analysis at AArete. That doesn’t include the subsequent loss of rebates, leaving plans with precious few resources to invest in ancillary benefits and improve the member experience.
To protect their Star Ratings and maintain their QBPs, MA plans must build an organization-wide culture of excellence that extends beyond the individual contributions of the Stars and Quality Teams. This culture requires leadership that starts at the top and is embedded in every department. Some plans tie Star Ratings to bonus metrics as an added way to promote a culture focused on quality.
Clinical Measures Grab the Spotlight
CMS’ Final Rule, published April 2, shifts Star Ratings and QBP calculations away from operational measures and toward clinical measures starting in Measurement Year 2027. The combined weight of annual member surveys, including the Consumer Assessment of Healthcare Providers and Systems (CAHPS) and Health Outcome Surveys (HOS), now puts patient experience and health outcomes on par with Healthcare Effectiveness Data and Information Set (HEDIS) measures in the ratings.
These changes create two challenges for MA plans. First, while CMS is eliminating operational targets from its ratings methodology, it will continue to monitor performance through audits and reporting. Without Stars bonuses available to fund operational processes like call centers and appeals and grievances, plans should automate these functions where possible while keeping humans in the loop to ensure compliance with regulatory guidance.
Second, achieving clinical and patient experience targets will be considerably more important to maintaining high Stars ratings. While operational goals like connecting members with foreign-language interpreters are fully within a plan’s control, encouraging members to follow through on preventive screening will require ongoing targeted communication and full buy-in from beneficiaries.
The stakes are high. AArete’s analysis indicates that only about 13% of contracts (about 4% of enrollment) are expected to remain unaffected or experience an improvement in Star Ratings when the administrative measures are removed. In contrast, 53% of contracts are projected to see a decline of up to 0.25 stars (about 87% of current enrollment).
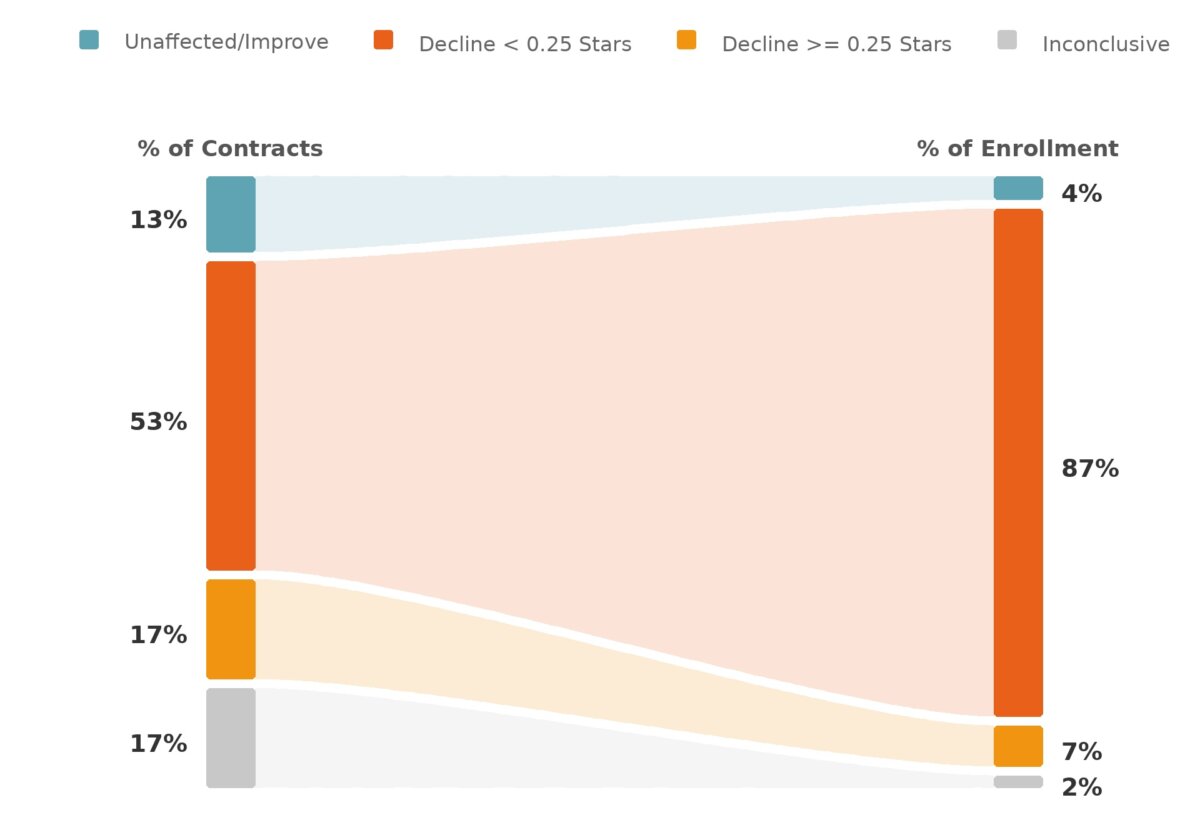
AArete’s analysis indicates a significant portion of contracts will see a decline in Star Ratings for Measurement Year 2027. These changes are prior to summary rating adjustments and Quality Improvement measure changes
The Clover Effect Adds Uncertainty
The federal district court ruling in favor of Clover Health in May created further disruption. Clover alleged that regulators improperly included 10 measures in its 2026 Star Ratings calculation and implemented 10 others without the required notice-and-comment rulemaking. As a result, Clover’s Star Ratings dropped from 4 to 3.5, costing the company roughly $120 million in bonus payments.
The court ruled in Clover’s favor and ordered CMS to recalculate its 2026 Star Ratings without the disputed measures. One month later, CMS issued updated 2027 QBP guidance, removing several Part D and administrative measures from its calculations and adopting a hold-harmless approach so plans would receive only higher, not lower, recalculated ratings.
While CMS has filed an appeal, the implications for MA plans are considerable. The ruling raises questions regarding the future use of administrative and operational measures and increases the likelihood of further litigation. Most of AArete’s Medicare Advantage health plan clients are assuming that the Clover ruling applies only to the 2026 Stars calculations. As such, they are continuing to assess their performance for the removed measures and implement interventions throughout Measurement Year 2026.
Move Forward by Strengthening Stars Governance
The timing of the Stars Rating overhaul couldn’t be worse, coming off a year when many MA plans reduced staffing in the face of cost pressures. That’s why maintaining Star Ratings will require input from everyone in the organization, along with strong governance. Here are three ways to move forward.
1. Focus on the right areas.
Regardless of future legal challenges, CMS is clear that clinical and quality measures will comprise the biggest portion of QBP calculations. Plans that seek to improve their performance in HEDIS, CAHPS, provider engagement, and member experience will be well-positioned. An immediate first step is to review 2026 clinical program and member engagement goals and determine which levers you need to deploy to finish the current calendar year strong.
2. Get your data house in order.
Plans that compile all their member data into a data lake or other shared repository will have an advantage over those that must piece it together across multiple systems. Once data is centralized, plans should use multiple years of data to document, assess, and revise each member’s end-to-end healthcare journey. When data show that a five-year member who gets her mammogram every March 5 misses her annual appointment, the organization can reach out proactively and encourage her to get screened.
3. Make Stars compliance everyone’s job.
When we engage with MA plans at AArete, we find that up to 80% of employees either do not know what Stars Ratings are or how they work. Plans in this situation should begin to establish a culture of excellence and communicate the importance of Stars. Consider establishing a cross-functional committee or other structure to lead the discussion and strategy around Stars governance. Invite leaders from IT, finance, compliance, and member experience teams along with the Stars and quality teams. Establish frequent touchpoints, monthly at a bare minimum, to share knowledge, course correct based on data, and monitor progress toward Star Ratings goals.
4. Automate Administrative Compliance Functions.
Our MA health plan clients are at varying stages of maturity in their use of AI. While some areas are more comfortable deploying AI, others are skittish due to misunderstanding of how it works. We see great success in starting small by automating routine, repeatable activities for productivity enhancements. It is important to document goals, objectives, and approaches to ensure transparency and promote alignment across functional areas. Given the current regulatory environment, humans should stay in the loop, even if it is just to monitor key metrics and audit results for consistency with expectations.
Looking to enhance your AI capabilities?
The Health Plan Guide to Scaling AI Enterprise Value guides you through where to begin when piloting or implementing AI across administrative and other functions.

Explore Other Opportunities
Beyond instituting disciplined governance, MA organizations should take these additional steps to protect their Star Ratings.
- Document key success factors by examining areas where the organization scored 4+ Stars, then use those insights to improve performance in low-rated measures.
- Assess vendor performance and internally managed programs for measures that score below 4 Stars, then re-evaluate your strategy.
- Examine vendor oversight practices and look for opportunities to instill greater rigor and hold vendors accountable for their results.
- Automate repeatable operational processes to reduce costs and refocus resources to higher-value activities that relate to clinical and quality goals.
Even a minor ratings drop has major implications
Few MA organizations can afford to shave half a point off their Stars Ratings. If your plan is evaluating its go-forward plan for Measurement Year 2027 and beyond, our team at AArete would be happy to compare notes and share insight into what we see in the market.
Our health plan consultants can help you assess your current Star Ratings governance model, evaluate your current vendors, develop data-driven dashboards, and build a culture of excellence.
Explore AArete’s Healthcare Payer Solutions.